
Note:
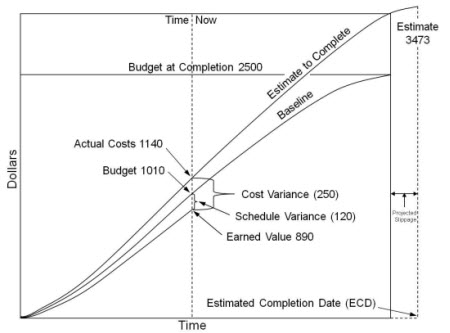
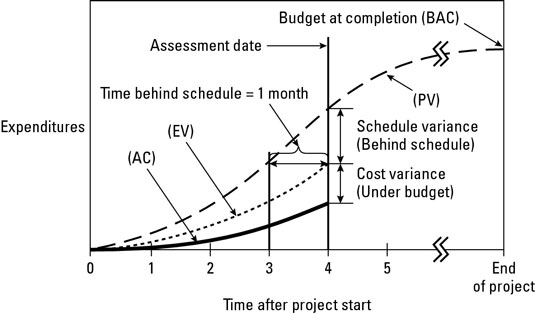
When extrapolating the EV curve, extend it to be in Synch with PV curve and make it intersect the BAC horizontal line. See the below image.
AC curve to be extrapolated such that it intersects the vertical line from where extrapolated EV curve intersects BAC.


Simple implementations (emphasizing only technical performance)[edit source]
There are many more small and simple projects than there are large and complex ones, yet historically only the largest and most complex have enjoyed the benefits of EVM. Still, lightweight implementations of EVM are achievable by any person who has basic spreadsheet skills. In fact, spreadsheet implementations are an excellent way to learn basic EVM skills.
The second step is to assign a value, called planned value (PV), to each activity. For large projects, PV is almost always an allocation of the total project budget, and may be in units of currency (e.g., dollars or euros) or in labor hours, or both. However, in very simple projects, each activity may be assigned a weighted “point value" which might not be a budget number. Assigning weighted values and achieving consensus on all PV quantities yields an important benefit of EVM, because it exposes misunderstandings and miscommunications about the scope of the project, and resolving these differences should always occur as early as possible. Some terminal elements can not be known (planned) in great detail in advance, and that is expected, because they can be further refined at a later time.
The third step is to define “earning rules” for each activity. The simplest method is to apply just one earning rule, such as the 0/100 rule, to all activities. Using the 0/100 rule, no credit is earned for an element of work until it is finished. A related rule is called the 50/50 rule, which means 50% credit is earned when an element of work is started, and the remaining 50% is earned upon completion. Other fixed earning rules such as a 25/75 rule or 20/80 rule are gaining favor, because they assign more weight to finishing work than for starting it, but they also motivate the project team to identify when an element of work is started, which can improve awareness of work-in-progress. These simple earning rules work well for small or simple projects because generally each activity tends to be fairly short in duration.
These initial three steps define the minimal amount of planning for simplified EVM. The final step is to execute the project according to the plan and measure progress. When activities are started or finished, EV is accumulated according to the earning rule. This is typically done at regular intervals (e.g., weekly or monthly), but there is no reason why EV cannot be accumulated in near real-time, when work elements are started/completed. In fact, waiting to update EV only once per month (simply because that is when cost data are available) only detracts from a primary benefit of using EVM, which is to create a technical performance scoreboard for the project team.
In a lightweight implementation such as described here, the project manager has not accumulated cost nor defined a detailed project schedule network (i.e., using a critical path or critical chain methodology). While such omissions are inappropriate for managing large projects, they are a common and reasonable occurrence in many very small or simple projects. Any project can benefit from using EV alone as a real-time score of progress. One useful result of this very simple approach (without schedule models and actual cost accumulation) is to compare EV curves of similar projects, as illustrated in Figure 5. In this example, the progress of three residential construction projects are compared by aligning the starting dates. If these three home construction projects were measured with the same PV valuations, the relative schedule performance of the projects can be easily compared.
Intermediate implementations (integrating technical and schedule performance)[edit source]
In many projects, schedule performance (completing the work on time) is equal in importance to technical performance. For example, some new product development projects place a high premium on finishing quickly. It is not that cost is unimportant, but finishing the work later than a competitor may cost a great deal more in lost market share. It is likely that these kinds of projects will not use the lightweight version of EVM described in the previous section, because there is no planned timescale for measuring schedule performance. A second layer of EVM skill can be very helpful in managing the schedule performance of these “intermediate” projects. The project manager may employ a critical path or critical chain to build a project schedule model. As in the lightweight implementation, the project manager must define the work comprehensively, typically in a WBS hierarchy. He/she will construct a project schedule model that describes the precedence links between elements of work. This schedule model can then be used to develop the PV curve (or baseline), as shown in Figure 2.
It should be noted that measuring schedule performance using EVM does not replace the need to understand schedule performance versus the project's schedule model (precedence network). However, EVM schedule performance, as illustrated in Figure 2 provides an additional indicator — one that can be communicated in a single chart. Although it is theoretically possible that detailed schedule analysis will yield different conclusions than broad schedule analysis, in practice there tends to be a high correlation between the two. Although EVM schedule measurements are not necessarily conclusive, they provide useful diagnostic information.
Although such intermediate implementations do not require units of currency (e.g., dollars), it is common practice to use budgeted dollars as the scale for PV and EV. It is also common practice to track labor hours in parallel with currency. The following EVM formulas are for schedule management, and do not require accumulation of actual cost (AC). This is important because it is common in small and intermediate size projects for true costs to be unknown or unavailable.
- Schedule variance (SV)
- SV greater than 0 is good (ahead of schedule). The SV will be 0 at project completion because then all of the planned values will have been earned.
However, Schedule Variance (SV) measured through EVM method is indicative only. To know whether a project is really behind or ahead of schedule (on time completion), Project Manager has to perform critical path analysis based on precedence and inter-dependencies of the project activities.
- Schedule performance index (SPI)
- SPI greater than 1 is good (ahead of schedule).
- See also earned schedule for a description of known limitations in SV and SPI formulas and an emerging practice for correcting these limitations.
Limitations[edit source]
Proponents of EVM note a number of issues with implementing it[11] ,[12] and further limitations may be inherent to the concept itself.EVM has no provision to measure project quality, so it is possible for EVM to indicate a project is under budget, ahead of schedule and scope fully executed, but still have unhappy clients and ultimately unsuccessful results. In other words, EVM is only one tool in the project manager's toolbox.There is the difficulty inherent for any periodic monitoring of synchronizing data timing: actual deliveries, actual invoicing, and the date the EVM analysis is done are all independent, so that some items have arrived but their invoicing has not and by the time analysis is delivered the data will likely be weeks behind events. This may limit EVM to a less tactical or less definitive role where use is combined with other forms to explain why or add recent news and manage future expectations.------------------------------------------------------------------------------------------------------------------------------------------------------Earned Schedule:“Did the accomplishment match exactly the expectation from the planned schedule?”
This is not the same as the preceding discussion of schedule performance efficiency,
where the volume of actual work accomplishment is compared to the expected volume
from the schedule. Schedule adherence is a more restrictive measure, and is
independent from performance efficiency.
A recent enhancement to EVM, Earned Schedule (ES), provides a means to
measure schedule adherence. ES is derived from two measures of EVM, planned value
(PV) and earned value (EV) [2]. The accumulated planned value from the project start to
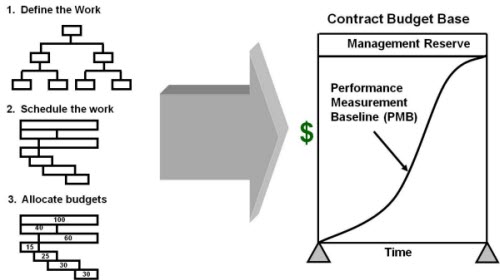
its planned completion is the performance measurement baseline (PMB) [1]. ES is the
time duration associated with the PMB where the PV is equal to the EV accrued.
The concept of ES is illustrated by Figure 1. Arrow A projects the accrued value
of EV onto the PMB to identify the point at which PV equals EV. Arrow B identifies the
time at which PV equals the EV accrued; i.e., the planned duration earned or ES. The
time at which the EV accrued appears is period 7. Whereas ES is determined to be the
duration of 5 periods; i.e., the time measure from the PMB where PV is equal to the EV
accrued at Time Now, or Actual Time (AT).
Two comparative measures, SVt and SVc, are shown in the diagram to illustrate the difference between the cost-based and time-based indicators of EVM and ES, respectively. The traditional EVM schedule variance is SVc, while the time-based schedule variance from ES is SVt 3
From the numbers shown in the diagram, SVt can be easily computed: SVt
= ES – AT = 5 – 7 = –2. Assuming the units are months, the project is 2 months behind its planned schedule.


No comments:
Post a Comment